Findings you can defend, on methods anyone can read.
The way we turn open-ended responses into codes and themes is published in peer-reviewed journals. When your board, a reviewer or a regulator asks how a finding was reached, you have a method to point to, and every count in your report opens on the words behind it.
Methods your reviewers can read for themselves.
Three peer-reviewed papers set out how we build codebooks and themes from open-ended responses, with every theme traced back to the responses it came from. Cite them in your own methods section.
Humanities & Social Sciences Communications Nature Portfolio 2026
GATOS: Generative AI-enabled Theme Organization and Structuring for Qualitative Research
Read the paper (opens the journal’s site in a new tab)International Journal of Qualitative Methods SAGE 2025
Leveraging Generative Text Models and Natural Language Processing to Perform Traditional Thematic Data Analysis
Read the paper (opens the journal’s site in a new tab)International Journal of Qualitative Methods SAGE 2024
Using Generative Text Models to Create Qualitative Codebooks for Student Evaluations of Teaching
Read the paper (opens the journal’s site in a new tab)
See who says what, not just what’s said.
You get each finding split by who said it. A difference is called only when it holds up after a statistical test, and where groups agree, the report says so just as plainly. Here, 1,806 responses about returning to the office: split the crowd by a group, then pick a finding.
81%of parents of young children (234) mention family and caregiving
14%of everyone else (1,572)
One dot is one person. People who mention the finding are lit, and fill each crowd from the bottom.

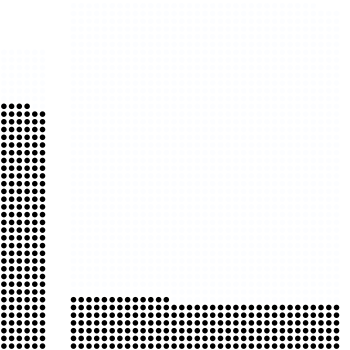
Parents of young children: mention it moreThe loss of flexibility makes it increasingly difficult to manage the logistical demands of childcare and my morning routine with my small children.graphic designer, under a year
Split by a group, then pick a finding.
Illustration: Return to the office, 1,806 simulated responses, none written by a real person. Each group is compared with everyone else using Fisher’s exact test, corrected across the seven findings (Holm); a difference is called only if it holds after that correction, otherwise it reads “about the same”. The groups come from the simulated respondents’ profiles, which were inputs to the generator, so some differences exist by design.
Map the reasons people give, not just the topics.
You get the causes respondents name, ranked by how many name them, so you can see where to step in, and every link opens on the sentences where people said it. It shows what people believe leads to what, not proof of cause. Here, 1,500 answers to “What has most affected how you feel about your work this year, and how?”
Each line reads “at least N say the first leads to the second”: “149+” means at least 149 respondents say so. Counts are minimums, because claims without a cause word weren’t counted.
What people say leads to thinking of leaving
before that: ,
before that: ,
before that:
before that:
Often mentioned together, but they connect through burnout and exhaustion
87 responses mention both long hours and overtime and thinking of leaving, yet no one says one leads straight to the other. People draw the path through burnout and exhaustion.
Mentioned together, never linked
77 responses mention both the flexible-hours policy and tension in the team. Not one says either leads to the other. A count of mentions would put them side by side; the map leaves them apart.
At least 117 say burnout and exhaustion leads to thinking of leaving
117 of 1,500 respondents, 9 of them hedged ("maybe", "probably"). What people say, not proof that burnout and exhaustion causes it.
The extreme level of exhaustion I felt this year led to my frequent thoughts about leaving this profession.
I have spent over ten years in this lab, and recently I feel a deep sense of exhaustion that makes me consider leaving.
The team being understaffed caused too few people for the work, resulting in long hours and overtime, which led to feeling burnt out and wanting to leave the job.
Select a line, or a cause in the list, to read the sentences behind it.
Select any line or cause to read what people said.
11 links made by fewer than 5 people
Too few to draw. Counts are minimums, like the map’s.
- At least 4 say feeling recognized leads to burnout and exhaustion
- At least 3 say sleep and health leads to thinking of leaving
- At least 3 say long hours and overtime leads to sleep and health
- At least 3 say reorganization leads to feeling recognized
- At least 3 say too few people leads to tension in the team
- At least 2 say burnout and exhaustion leads to long hours and overtime
- At least 2 say tension in the team leads to sleep and health
- At least 1 says control over my schedule leads to burnout and exhaustion
- At least 1 says control over my schedule leads to motivation and engagement
- At least 1 says a manager's support leads to burnout and exhaustion
- At least 1 says a manager's support leads to thinking of leaving
Illustration: Workplace wellbeing, 1,500 simulated responses, none written by a real person. How the map was built: every sentence with a cause word (because, led to, so, which means and others) was read, and each claim was coded as “A leads to B”; negated, hypothetical and “go together” statements were left out. A link is drawn when at least 5 people make it (20 are; 11 thinner links are listed under the map, not drawn). The concepts and rules were fixed and recorded before the data’s answer key was opened. Counts are minimums: sentences without a cause word weren’t read, so every count is lower than the true number. Checked afterwards against the links built into the data, the map found 20 of the 23 links that 5 or more people make, and drew none that weren’t there and none backwards. The counts come from that first, blind pass; the quotes come from a clerical correction made afterwards, so each quote is the sentence it was coded from. One display change was made after the check: the fixed rule for the “mentioned together” panel picked long hours and leaving, which connect through burnout, so the panel also shows the pair that is never linked.
Shorter reads, for the decision in front of you.
Briefs and guides on turning open-ended feedback into decisions, and answers to the questions clients ask before an engagement.
- BriefVoice of Customer - Transforming Feedback into Product Strategy7 min read
- BriefThe Future of Machine-Assisted Qualitative Research8 min read
- BriefUnderstanding Thematic Analysis in Qualitative Research6 min read
- WhitepaperHealthcare Patient Experience - A Comprehensive Guide
- FAQQuestions clients ask before an engagement
Bring us the question your data has to answer.
Tell us what you have and the decision it needs to inform. On a scoping call we’ll say what an analysis can and can’t answer before any work starts.